There are a lot of sites that will tell you which U.S. cities are the best places to live right now.
But we wanted to go a step further than that. We wanted to get ahead of the curve.
We didn’t want to know the 25 best cities to live in right now. We wanted to know the Next 25.
Which cities are right on the cusp of becoming the best places to live? Or, which cities are already great, but continuing to get bigger and better?
That’s how the Neighbor Next 25 was born.
We’re confident in saying that these 25 cities are the most up-and-coming places to live in the U.S. We studied a number of factors that show which cities are growing and improving (and weathering the ongoing coronavirus pandemic without major economic turmoil) and we landed on these 25. If you’re looking for the “next big thing” in places to live, look no further.
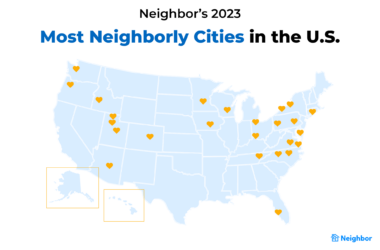
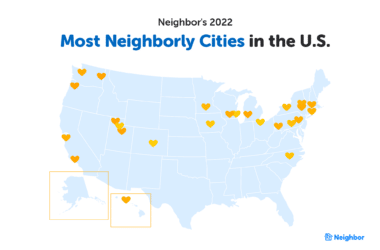
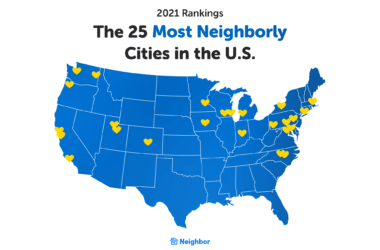
| Related: The 25 Most Neighborly Cities in America |
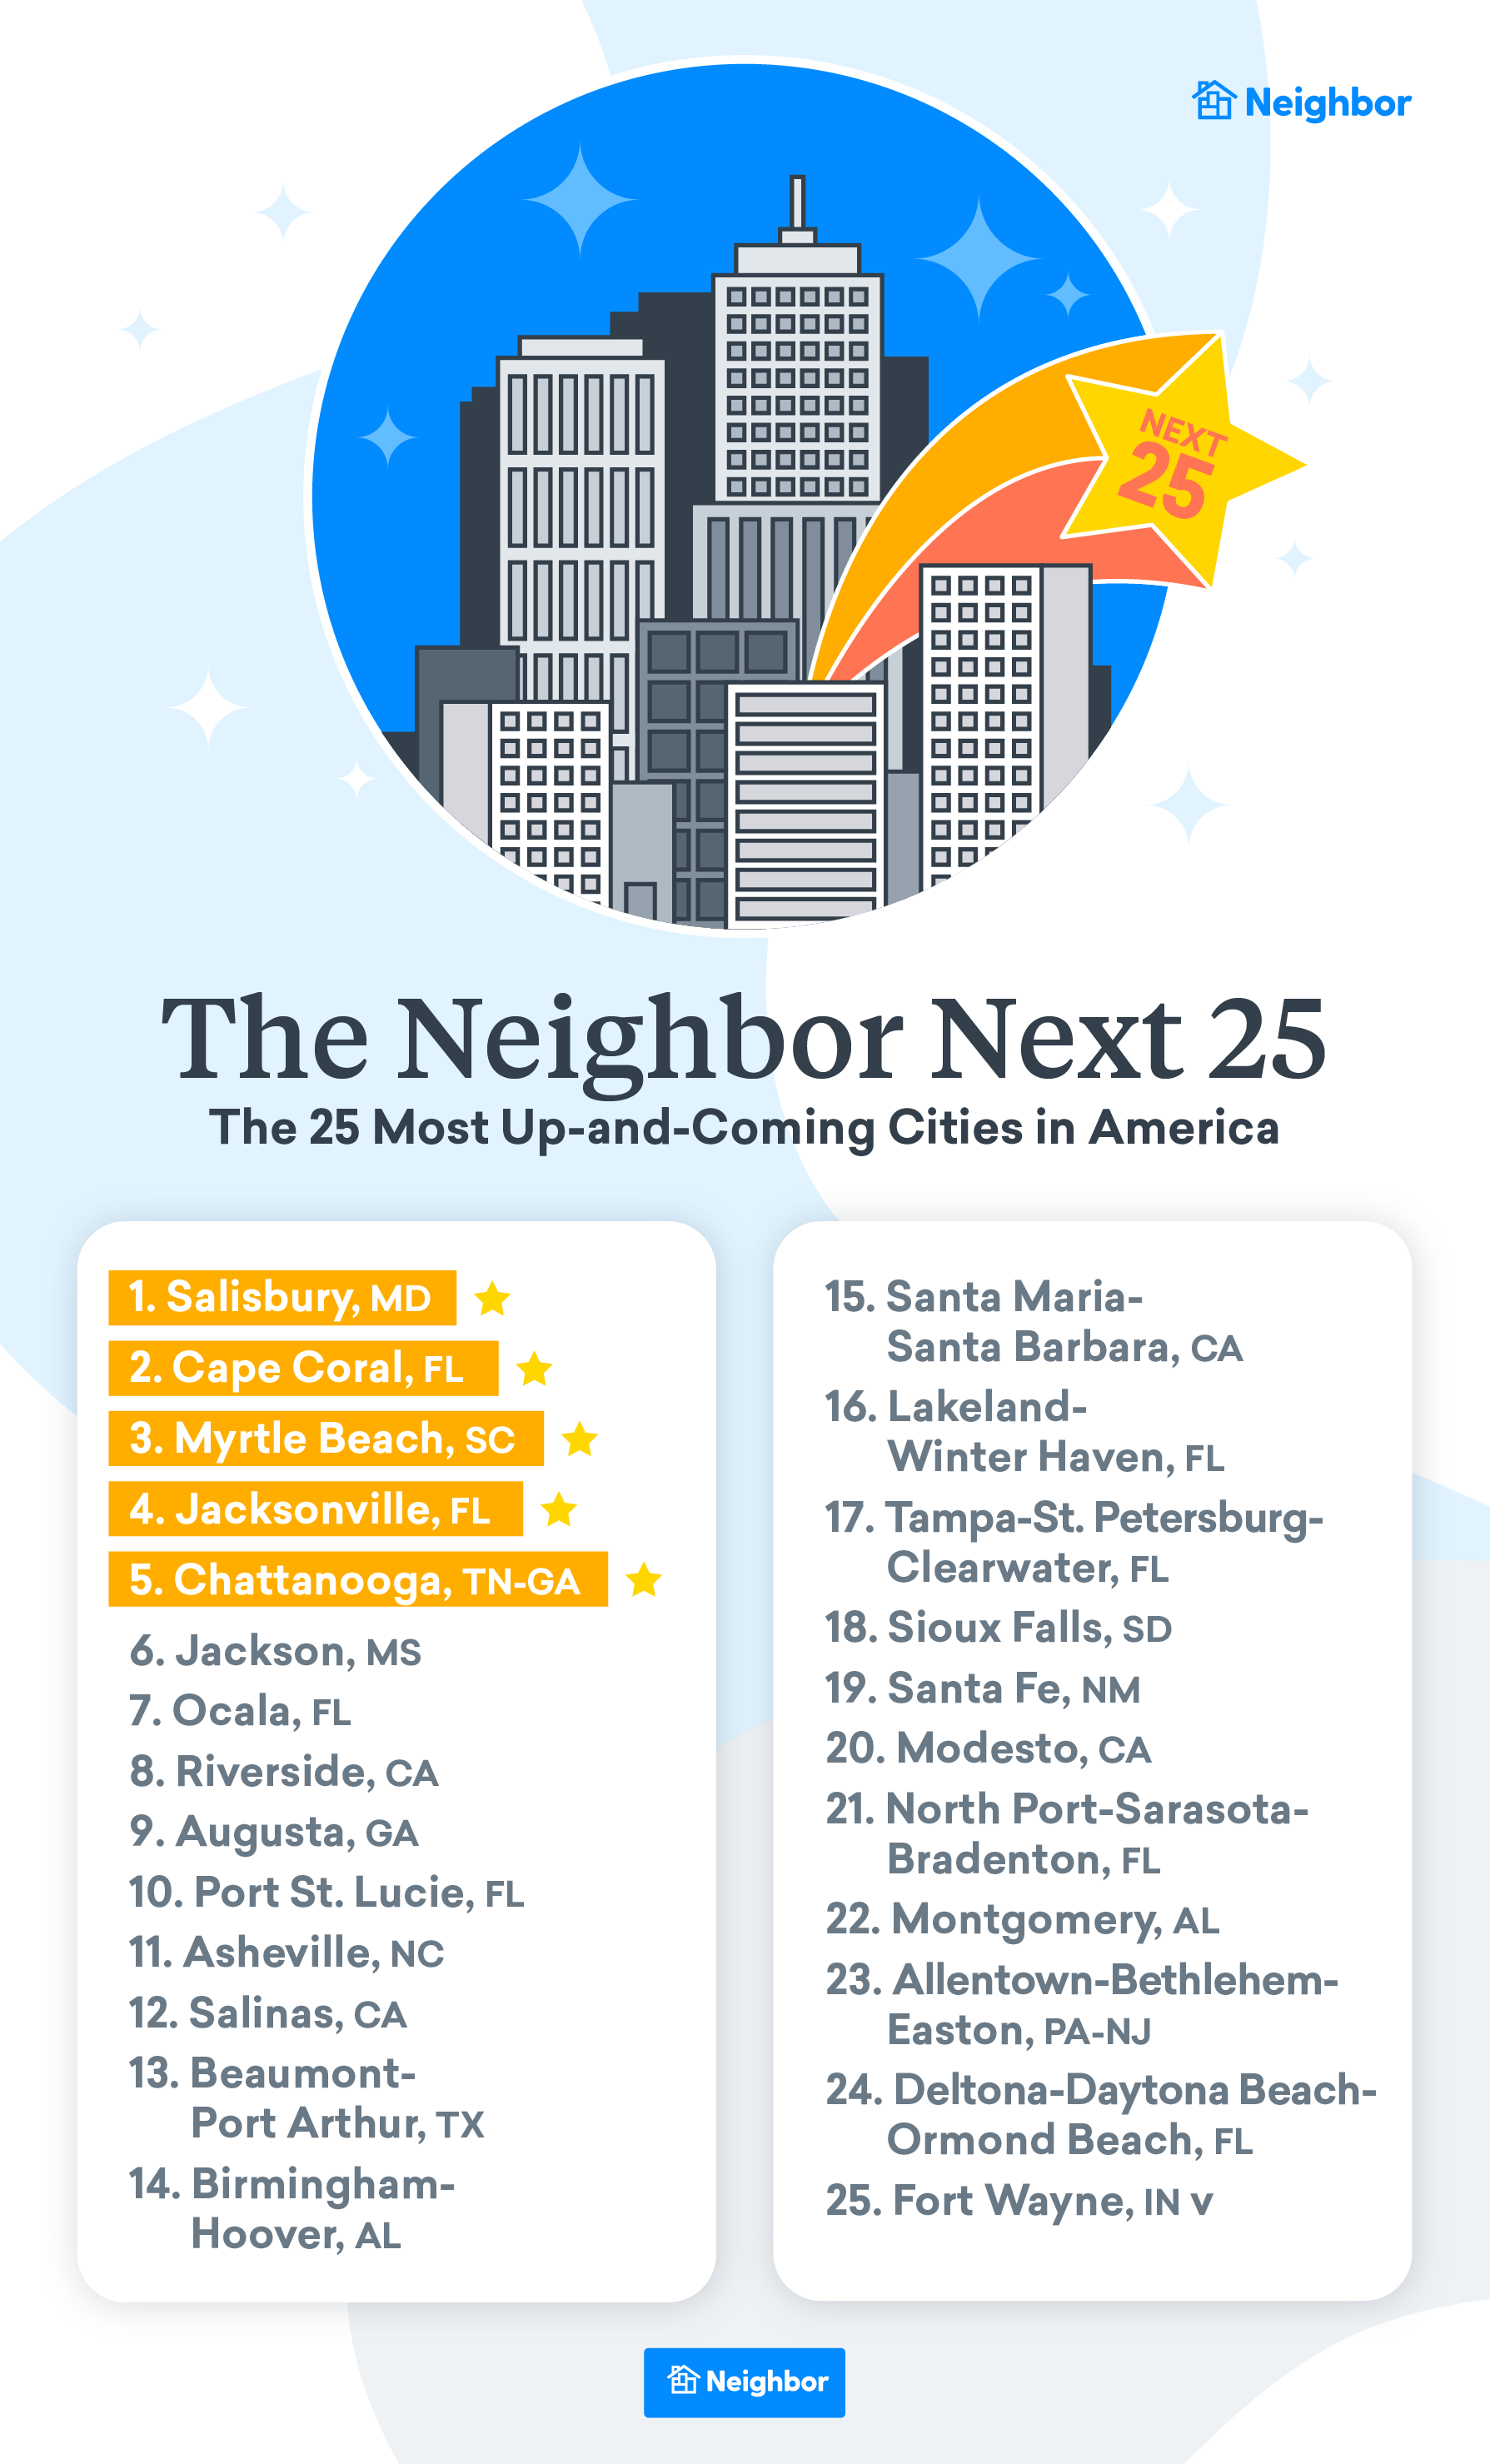
These are the Next 25 Up-and-Coming American Cities
Let’s dive into the cities that made the 2021 Neighbor Next 25!
The No.1 most up-and-coming U.S. city is…

1. Salisbury, MD
Diversity Score: 49/100
Well-Being Improvement: Unranked in 2013 to 17th in 2018
Change in Unemployment: +1.1%
Population Growth: +10.9%
Housing Permit Growth: +24.9%
Housing Per Capita: 0.6 homes per resident
Salisbury, Maryland, the largest city in the state’s Eastern Shore region, is our No. 1 up-and-coming city!
Salisbury got a major boost from its well-being index scores — it didn’t even make the top 200 cities in 2013, but was ranked 17th just five years later. That’s a city that’s investing in the well-being of its residents at a high rate.
While Salisbury, like most of the U.S., saw an increase in unemployment in 2020, it was just over 1%, much less than the national increase of more than 6%. We think that indicates that Salisbury is economically stable and is handling the global pandemic with more resiliency than the average city.
It’s clear that people are already catching on — Salisbury has seen a significant boost in its population in recent years. But new housing builds are outpacing population growth, which means housing is still affordable here for new and existing residents alike.
Salisbury provides arts, museums, a regional airport, and a number of surrounding state forests and wildlife areas where residents can pursue virtually limitless recreational activities. Norfolk, VA, Washington, D.C., Baltimore, and Philadelphia are all accessible within a day’s drive or train journey, which puts big-city amenities well within reach of this relatively small metro area.
Those are just some of the reasons Salisbury, MD has much to offer new residents, and deserves its top spot on the Neighbor Next 25.

2. Cape Coral, FL
Diversity Score: 47/100
Well-Being Improvement: 149th in 2013 to 6th in 2018
Change in Unemployment: +2.9%
Population Growth: +24.2%
Housing Permit Growth: +27%
Housing Per Capita: 0.5 homes per resident
The Gulf city of Cape Coral, FL, has a lot to offer those who might want to call it home in the future.
What landed it solidly in the No. 2 spot in our rankings was the fact that its spot on the Well-Being Index increased 143 places, to land it in the top 10 cities for well-being in 2018.
In addition to that, Cape Coral is growing. It saw nearly a 25% population increase in the last decade, but new housing construction is keeping pace, with a 27% increase in permits filed in the last year, which should help ensure that housing in the city stays affordable.
In addition to warm and sunny weather almost year-round, Cape Coral is known for its beaches, canals, golf courses, and family entertainment.
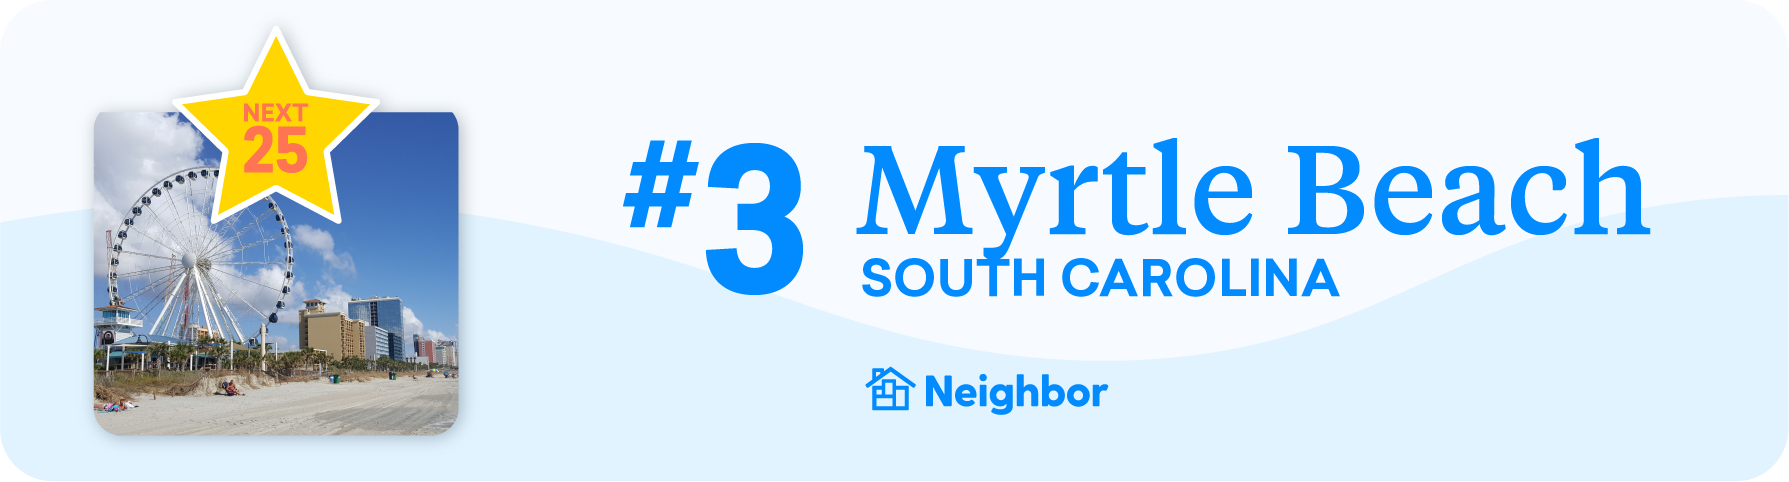
3. Myrtle Beach, SC
Diversity Score: 36/100
Well-Being Improvement: 164th in 2013 to 36th in 2018
Change in Unemployment: +2.4%
Population Growth: +31.3%
Housing Permit Growth: +14.8%
Housing Per Capita: 0.6 homes per resident
Myrtle Beach is one of the less diverse cities in our rankings, but its increase in the Well-Being Index made up for that — it moved from 164th in 2018 to just outside of the top third of healthy cities five years later.
People are clearly catching on — Myrtle Beach has seen more than a 30% increase in its population since 2010. While housing growth is solid at a nearly 15%over the last year, this is a city that’s growing in people faster than it’s growing in residences, so you might expect the cost of living here to increase somewhat in the coming years.
Still, Myrtle Beach’s sunny weather, beaches and boardwalks, golf courses, amusement parks and more make it a destination we think is only going to increase in popularity, whether you’re single or moving with a family.

4. Jacksonville, FL
Diversity Score: 54/100
Well-Being Improvement: 159th in 2013 to 48th in 2018
Change in Unemployment: +2.5%
Population Growth: +15.6%
Housing Permit Growth: +4.1%
Housing Per Capita: 0.4 homes per resident
Coming in at No. 4 is Jacksonville, another sunny and warm city with a lot of diversity and a healthy population, according to its top 50 spot in the most recent Well-Being Index.
One note to make about Jacksonville is that its population growth is far outpacing its housing growth, which may increase the city’s cost of living.

5. Chattanooga, TN-GA
Diversity Score: 36/100
Well-Being Improvement: 179th in 2013 to 40th in 2018
Change in Unemployment: +1.3%
Population Growth: +6.8%
Housing Permit Growth: +1.5%
Housing Per Capita: 0.4 homes per resident
Chattanooga rounds out our top 5. Though it’s not the most diverse city on our list by any means, Chattanooga showed huge gains in its residents’ well-being over five years.
Plus, while the national unemployment rate grew by around 6 percent in 2020, Chattanooga saw just a 1.3% increase for its own residents. This is a city full of healthy, happy people with a resilient economy. That makes it well worth keeping an eye on.
6. Jackson, MS
Diversity Score: 54/100
Well-Being Improvement: 167th in 2013 to 72nd in 2018
Change in Unemployment: +0.9%
Population Growth: +1.1%
Housing Permit Growth: +22.6%
Housing Per Capita: 0.4 homes per resident
Overall, Jackson ranked fairly high in diversity and well-being. What’s really worth watching in this city, though, is that new housing is growing far faster than the population. That’s a likely indication that Jackson is going to be an extremely affordable place to live for years to come.
7. Ocala, FL
Diversity Score: 46/100
Well-Being Improvement: 121st in 2013 to 27th in 2018
Change in Unemployment: +2.6%
Population Growth: +10.3%
Housing Permit Growth: +62.2%
Housing Per Capita: 0.5 homes per resident
Ocala’s diversity and unemployment are pretty middle-of-the-road, though the city did see big gains in its Well-Being Index. What really sets this spot apart from others on the list is that new housing construction is far outpacing population growth. Ready to enjoy Florida weather with a low cost of living? Ocala may just be the place to do it.
8. Riverside, CA
Diversity Score: 71/100
Well-Being Improvement: 129th in 2013 to 65th in 2018
Change in Unemployment: +4.2%
Population Growth: +9.6%
Housing Permit Growth: +3%
Housing Per Capita: 0.3 homes per resident
Riverside is one of the most diverse cities to make our list. That means, for anyone looking for a community with a wealth of cultures, food, arts, and music, Riverside is likely to be a good pick.
Moving to Riverside won’t likely protect you from California cost of living, though — new housing permits increased by less than a third of the city’s population growth.
9. Augusta, GA
Diversity Score: 57/100
Well-Being Improvement: 141st in 2013 to 76th in 2018
Change in Unemployment: +1.9%
Population Growth: +7.5%
Housing Permit Growth: +8.6%
Housing Per Capita: 0.4 homes per resident
Augusta is a pretty diverse city, and it saw solid well-being improvement in five years. But what lands it within the top 10 up-and-coming cities is that unemployment there increased by less than 2% in 2020 — well below the national average. Plus, Augusta is seeing steady population growth, with steady growth in new residential permits to match.

10. Port St. Lucie, FL
Diversity Score: 37/100
Well-Being Improvement: 105th in 2013 to 11th in 2018
Change in Unemployment: +2.4%
Population Growth: +15.1%
Housing Permit Growth: +29.5%
Housing Per Capita: 0.5 homes per resident
Port St. Lucie is one of the less diverse cities in our rankings. But its well-being improvement took it from outside of the top 100 cities in 2013, to almost in the top 10 in 2018. On top of that, Port St. Lucie has seen astronomical population growth in the last decade, but to keep pace with all the people who seem to be moving there, new housing permits increased by nearly 30% in the last year.
11. Asheville, NC
Diversity Score: 26/100
Well-Being Improvement: 140th in 2013 to 10th in 2018
Change in Unemployment: +3%
Population Growth: +8.8%
Housing Permit Growth: +18.6%
Housing Per Capita: 0.5 homes per resident
12. Salinas, CA
Diversity Score: 68/100
Well-Being Improvement: 34th in 2013 to 2nd in 2018
Change in Unemployment: +3%
Population Growth: +4.2%
Housing Permit Growth: +83.9%
Housing Per Capita: 0.3 homes per resident
13. Beaumont-Port Arthur, TX
Diversity Score: 59/100
Well-Being Improvement: 184th in 2013 to 107th in 2018
Change in Unemployment: +6.5%
Population Growth: +0.9%
Housing Permit Growth: +86.6%
Housing Per Capita: 0.4 homes per resident
14. Birmingham-Hoover, AL
Diversity Score: 52/100
Well-Being Improvement: 145th in 2013 to 80th in 2018
Change in Unemployment: +1.6%
Population Growth: +2.7%
Housing Permit Growth: +31%
Housing Per Capita: 0.4 homes per resident

15. Santa Maria-Santa Barbara, CA
Diversity Score: 79/100
Well-Being Improvement: 41st in 2013 to 12th in 2018
Change in Unemployment: +2.6%
Population Growth: +5.3%
Housing Permit Growth: -43.3%
Housing Per Capita: 0.4 homes per resident
16. Lakeland-Winter Haven, FL
Diversity Score: 57/100
Well-Being Improvement: 138th in 2013 to 91st in 2018
Change in Unemployment: +4.1%
Population Growth: +20%
Housing Permit Growth: +11.7%
Housing Per Capita: 0.4 homes per resident
17. Tampa-St. Petersburg-Clearwater, FL
Diversity Score: 55/100
Well-Being Improvement: 152nd in 2013 to 98th in 2018
Change in Unemployment: +2.9%
Population Growth: +14.6%
Housing Permit Growth: -14.3%
Housing Per Capita: 0.4 homes per resident
18. Sioux Falls, SD
Diversity Score: 57/100
Well-Being Improvement: Not ranked in 2013 or 2018
Change in Unemployment: +0.1%
Population Growth: +17.1%
Housing Permit Growth: +79.9%
Housing Per Capita: 0.4 homes per resident
19. Santa Fe, NM
Diversity Score: 80/100
Well-Being Improvement: Not ranked in 2013 or 2018
Change in Unemployment: +3.1%
Population Growth: +4%
Housing Permit Growth: +5.2%
Housing Per Capita: 0.5 homes per resident

20. Modesto, CA
Diversity Score: 64/100
Well-Being Improvement: 151st in 2013 to 124th in 2018
Change in Unemployment: +3%
Population Growth: +6.9%
Housing Permit Growth: +60%
Housing Per Capita: 0.3 homes per resident
21. North Port-Sarasota-Bradenton, FL
Diversity Score: 37/100
Well-Being Improvement: 77th in 2013 to 9th in 2018
Change in Unemployment: +2.4%
Population Growth: +19%
Housing Permit Growth: -1%
Housing Per Capita: 0.5 homes per resident
22. Montgomery, AL
Diversity Score: 57/100
Well-Being Improvement: 119th in 2013 to 71st in 2018
Change in Unemployment: +2.7%
Population Growth: -0.5%
Housing Permit Growth: +28%
Housing Per Capita: 0.5 homes per resident
23. Allentown-Bethlehem-Easton, PA-NJ
Diversity Score: 45/100
Well-Being Improvement: 157th in 2013 to 90th in 2018
Change in Unemployment: +2.1%
Population Growth: +2.7%
Housing Permit Growth: +26.7%
Housing Per Capita: 0.4 homes per resident
24. Deltona-Daytona Beach-Ormond Beach, FL
Diversity Score: 44/100
Well-Being Improvement: 161st in 2013 to 110th in 2018
Change in Unemployment: +2.9%
Population Growth: +13.2%
Housing Permit Growth: +40%
Housing Per Capita: 0.5 homes per resident

25. Fort Wayne, IN
Diversity Score: 41/100
Well-Being Improvement: 153rd in 2013 to 79th in 2018
Change in Unemployment: +1.7%
Population Growth: +6.2%
Housing Permit Growth: -5.7%
Housing Per Capita: 0.4 homes per resident
How we determined our city rankings
We looked at a wide variety of factors, using data that mostly came from the U.S. Census Bureau.
Diversity Score: There are many studies that show that diverse communities are healthier and happier. We used Census data and the USA TODAY Diversity Index to give each of these cities a diversity score out of 100. This metric was given high weight in our final calculation.
Well-Being Improvement: We used Gallup’s State of American Well-Being reports, which consider factors like physical health, emotional health, work environments, and healthy behaviors to determine the healthiest, happiest cities in the nation. For our rankings, we compared the cities’ well-being rankings in 2013 and 2018, and tracked how much resident well-being has improved over time. This metric was given high weight in our final calculation.
Change in Unemployment: Using Bureau of Labor Statistics data, we compared unemployment rates in November of 2019, and November of 2020. Because of the COVID-19 pandemic, most cities saw an increase in unemployment in that time. However, those with smaller increases seemed to be more economically resilient. This metric was given medium weight in our final calculation.
Population Growth: This ranking isn’t about which cities are best right now. So we looked at Census data to see which cities are actively growing and factored in their rate of growth from 2010 to 2019. This metric was given medium weight in our final calculation.
Housing Permit Growth: Another metric that we felt indicated sustainable growth in a city was how many new residential building permits have been filed. We used Census data to compare permit numbers in 2019 and 2020, and factored in the rate of increase (or decrease) in new permits in the last year. This metric was given low weight in our final calculation.
Housing Per Capita: And finally, we wanted to make sure that housing was keeping up with population growth (a major factor in whether housing remains affordable in a growing city). For this, we compared Census data on existing housing units and city populations to determine housing per capita in each up-and-coming city. This metric was given low weight in our final calculation.