Neighbor, the leading self storage and parking marketplace in the United States, has researched and compiled the following U.S. self storage industry statistics and data. This yearly resource will be updated as new data becomes available and is intended to serve as the ultimate guide to self storage statistics.
Last Updated: Oct 2024
Contents:
- Industry Snapshot
- Supply Statistics – Construction, inventory, square footage, etc.
- Demand Statistics – Occupancy, pricing, seasonality, duration, etc.
- Industry Statistics – Revenue, financials, performance, etc.
- Sources
Self Storage Industry Snapshot
| Industry revenue | $58.3 billion |
| Construction spend | $7.4 billion |
| Facility average occupancy | 91.6% |
| Facility count | 52,301 |
| Share of renting households | 11.1% |
| Rentable square footage | 2.1 billion sq. ft. |
| Average storage unit price | $114.51/month |
| Average rental duration | 14 months |
| Profit margin | 36% |
Storage Supply Statistics
Self Storage Construction
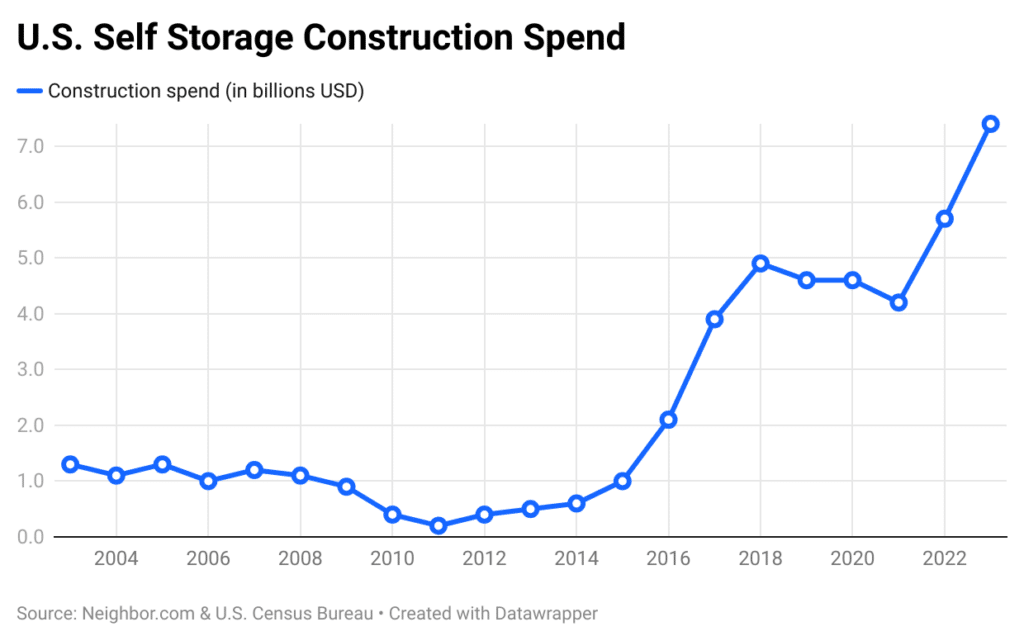
| Self storage construction spend (2023) | $7.4 billion |
| 1-year spend change | 29% |
| 10-year spend change | 1474% |
| 20-year spend change | 460% |
In 2023, self storage facility construction spend in the United States skyrocketed to $7.4B from its recent 2021 low of $4.2B. With a 29% 1-year growth compared to 2022, a 1474% 10-year increase, and a lower 460% 20-year increase. As American demand for self storage has increased, peaking in 2021, construction has accelerated.
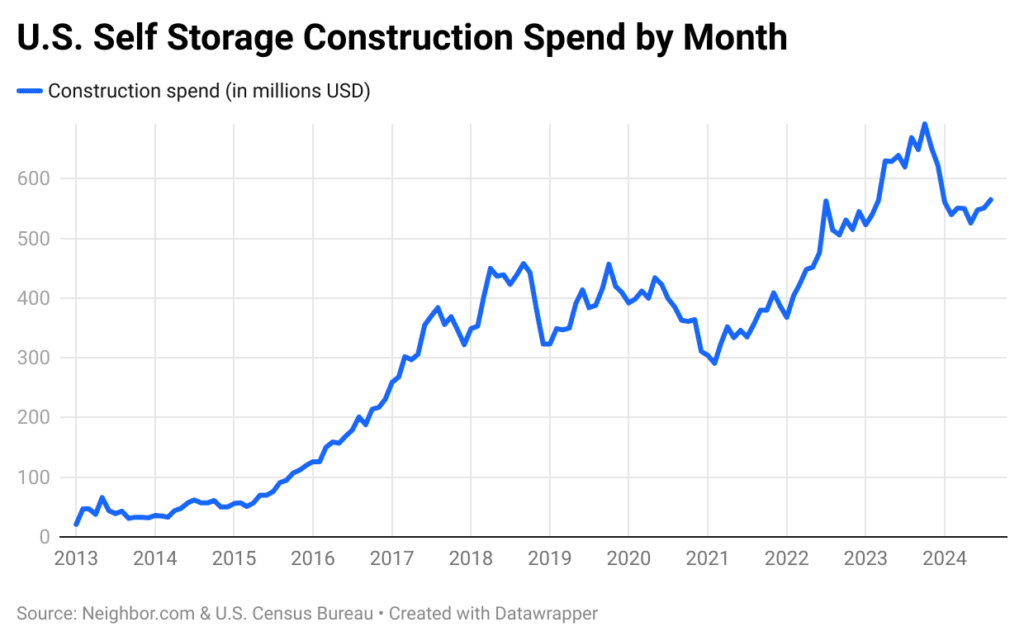
Looking forward, however, supply in the pipeline has began to slow in 2024. Monthly mini-storage construction spend, according to the U.S. Census Bureau, has dropped 18% (as of August 2024) since the October 2023 peak of $692 million.
Storage Facility Count
| Total facilities | 52,301 |
| Most facilities by state | Texas – 5,564 |
| Least facilities by state | Hawaii – 94 |
With the increase of self storage construction over the last 8 years, the number of storage facilities has significantly increased. The estimated number of storage facilities in the U.S. is 52,301. Texas has the most storage facilities with 5,564 while Hawaii has the least amount of self storage facilities at 94.
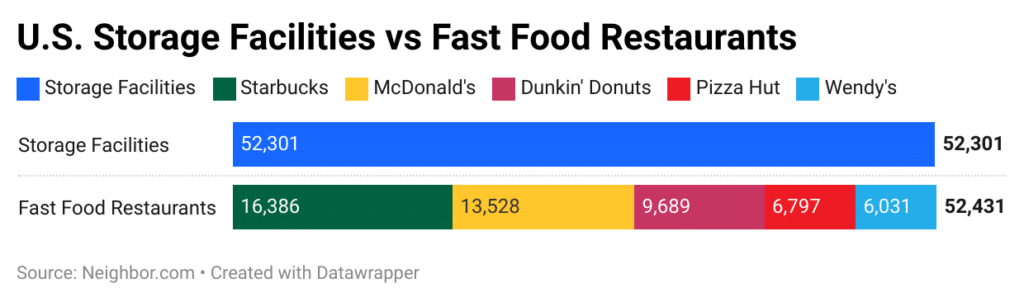
Storage Facilities vs. Fast Food
| Count of Storage Facilities | 52,301 |
| Count of Selected Fast Food Restaurant U.S. Locations | 52,431 |
| – Starbucks | – 16,386 |
| – McDonald’s | – 13,528 |
| – Dunkin’ Donuts | – 9,689 |
| – Pizza Hut | – 6,797 |
| – Wendy’s | – 6,031 |
To put into perspective just how many 52,301 storage facilities actually is, there are as many facilities as all of the U.S. locations of Starbucks, McDonald’s, Dunkin’ Donuts, Pizza Hut and Wendy’s.
Self Storage Rentable Square Footage
| Rentable Square Footage | 2.1 billion sq. ft. |
| Rentable Square Footage per Person | 6.1 square feet per person |
| Most Rentable Square Footage by State | Idaho – 12.5 sq. ft. / person |
| Least Rentable Square Footage by State | Hawaii – 3.2 sq. ft. / person |
There is over 2.1 billion square feet of rentable self storage space in the United States. Idaho has the most rentable square footage per person at 12.5 square feet and Hawaii having the least amount with 3.2 square feet per person.
Storage Demand Statistics
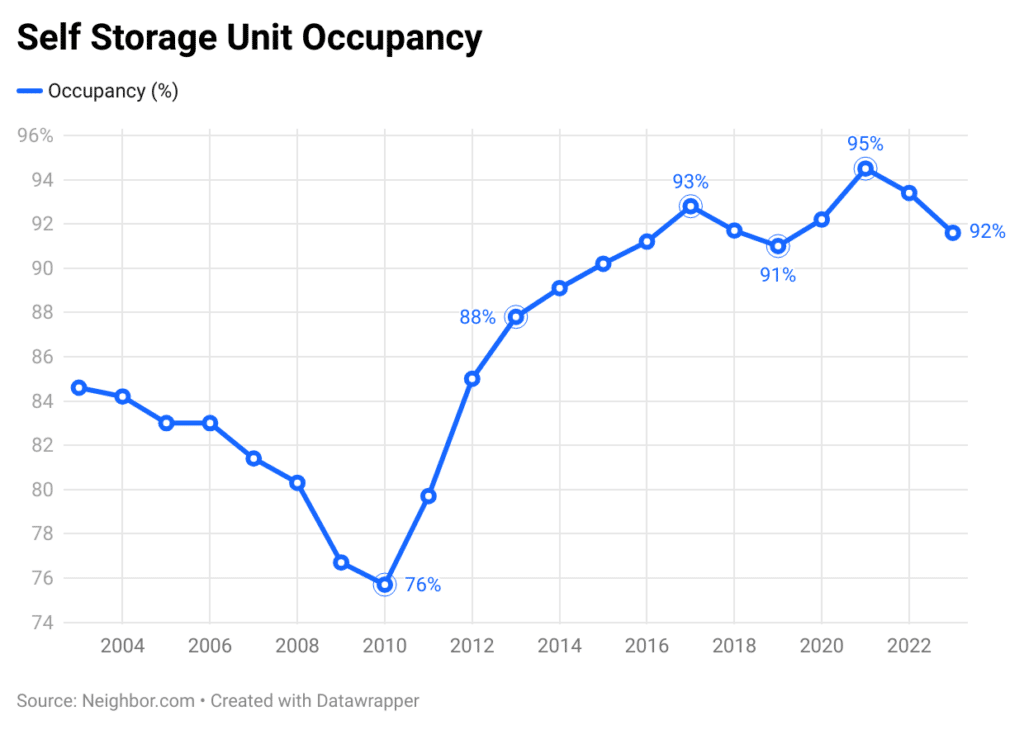
Self Storage Facility Occupancy
| Facility Occupancy | Rate |
|---|---|
| 2023 | 91.6% |
| 1-year change | -1.9% |
| 10-year change | 4.3% |
The national average self storage occupancy rate in 2023 decreased to 91.6%, roughly 2% lower than the year prior. Since 2000, the low was 76% in 2010 and peaked in 2021 at 95%.
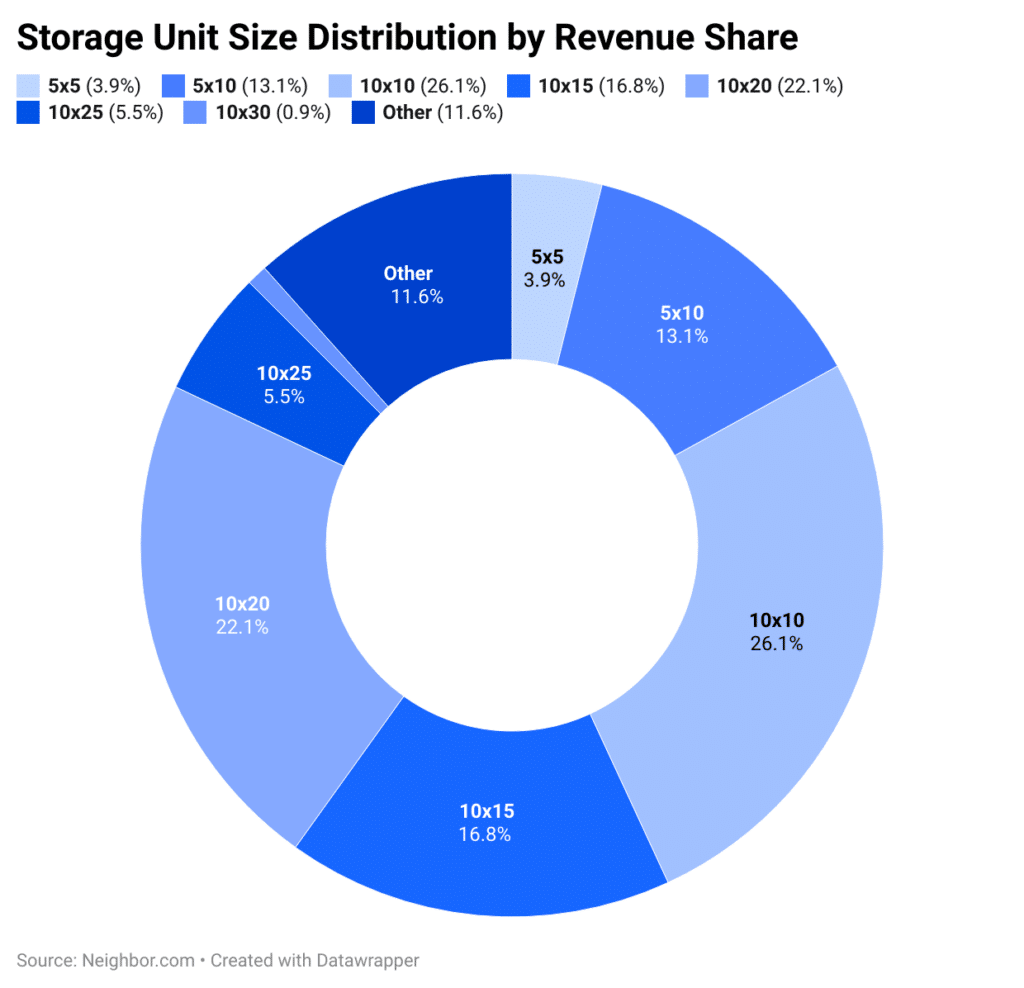
Storage Unit Size Distribution
| Unit Size | Revenue Share |
|---|---|
| 5×5 | 3.9% |
| 5×10 | 13.1% |
| 10×10 | 26.1% |
| 10×15 | 16.8% |
| 10×20 | 22.1% |
| 10×25 | 5.5% |
| 10×30 | 0.9% |
| Other | 11.6% |
According to IBISWorld, the most popular storage unit size by revenue is 10-by-10 feet. 10-by-20 is a close second and then 10-by-15. Often a go-to unit for basic storage needs, 5-by-5 storage units are one of the least popular standard storage unit sizes.
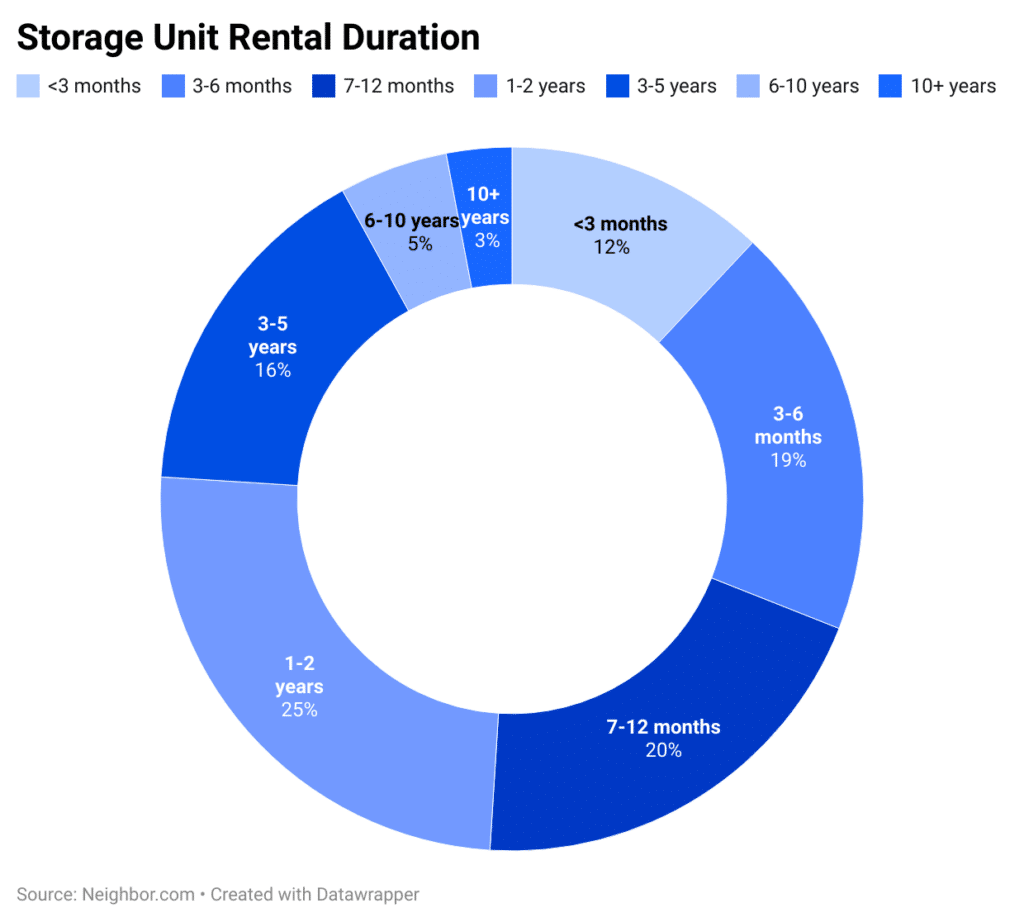
Storage Unit Rental Duration
| Rental Duration | Percent of Rentals |
|---|---|
| < 3 months | 12% |
| 3 – 6 months | 19% |
| 7 – 12 months | 20% |
| 1 – 2 years | 25% |
| 3 – 5 years | 16% |
| 6 – 10 years | 5% |
| 10+ years | 3% |
The average rental duration of a storage unit is approximately 14 months, with nearly half of tenants renting for over 1 year. Only 12% of storage unit tenants store for less than 3 months and about 3% store for more than 10 years.
National Average Rate
| 10×10 non-climate controlled national average | $114.51 |
| 10×10 climate controlled national average | $145.09 |
Rental Rates by Size (non-climate-controlled)
| Unit Size | Avg. Rental Rate | Price per Square Foot | YoY Change |
|---|---|---|---|
| 5×5 | $53.89 | $2.17 | -5.7% |
| 5×10 | $75.42 | $1.52 | -4.4% |
| 10×10 | $114.51 | $1.15 | -5.7% |
| 10×15 | $145.68 | $0.98 | -4.9% |
| 10×20 | $172.76 | $0.87 | -3.3% |
The U.S. national average cost of a climate-controlled storage unit in 2023 was $145.09 per month and $114.51 for non-climate-controlled.
Non-climate-controlled storage unit rate decreased between 3.3% and 5.7% depending on the size from 2022 to 2023.

Highest Rental Rates by Market
| Market | 10×10 Climate-Controlled | 10×10 Non-Climate-Controlled |
|---|---|---|
| New York (Metro), NY | $325.91 | $282.47 |
| San Francisco, CA | $270.27 | $277.24 |
| Los Angeles, CA | $255.29 | $210.76 |
New York City, NY is the most expensive market for 10×10 climate-controlled and non-climate-controlled storage units, followed by San Francisco, CA and Los Angeles, CA.
Highest Growth Rate of Rental Rate by Market
| Market | 10×10 Climate-Controlled |
|---|---|
| Las Vegas, NV | 4.0% |
| Minneapolis, MN | 3.1% |
| Fresno, CA | 3.0% |
For a 10×10 climate-controlled self storage unit, the Las Vegas, NV self storage market saw the fastest 2023 annual compound annual growth rate (CAGR) of 4.0%. Minneapolis, MN and Fresno, CA saw the second and third fastest CAGRs, respectively.
| Market | 10×10 Non-Climate-Controlled |
|---|---|
| Phoenix, AZ | 4.2% |
| San Bernardino/Riverside, CA | 3.7% |
| Indianapolis, IN | 3.3% |
In 2023, self storage in Phoenix, AZ experienced the fastest compound annual growth rate (CAGR) of 4.2%. This was followed by San Bernardino, CA and Riverside, CA and then Indianapolis, IN.
Households Renting Storage
| U.S. households renting storage | 11.1% |
Over 11% of households in the United States are currently renting a self storage unit, or 14,465,772 storage renting households out of 130,023,135 U.S. households.
Self Storage Industry Data
Self Storage Industry Revenue
| Industry Revenue | |
|---|---|
| 2023 | $58.3 billion |
| 1-year change | 0.2% |
| 10-year change | 14.9% |
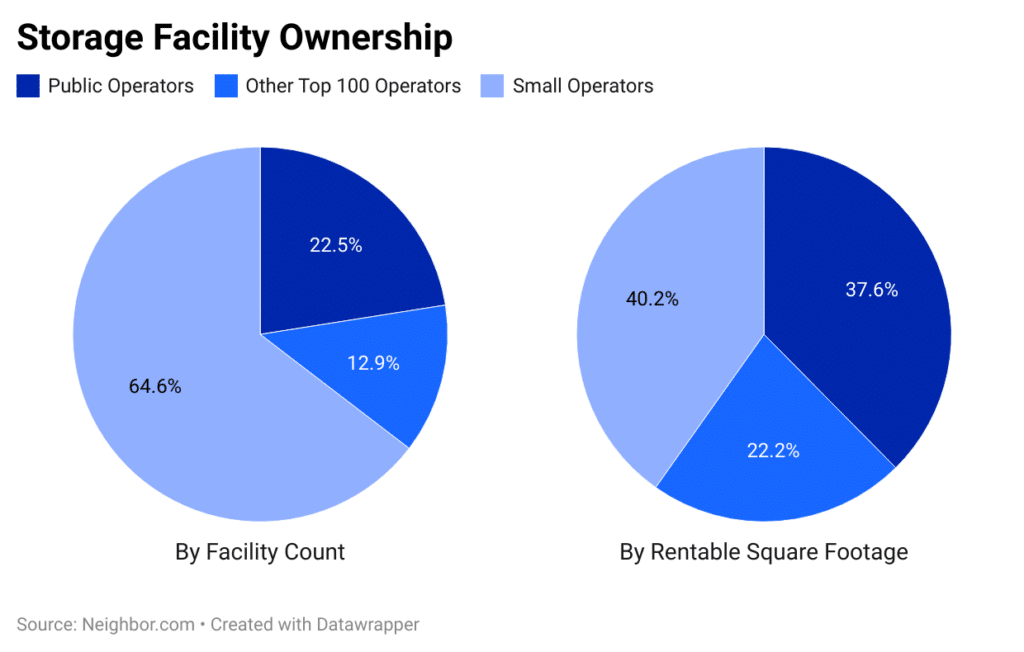
Facility Ownership
| By Facility Count | |
| Public Operators | 22.5% |
| Other Top 100 Operators | 12.9% |
| Small Operators | 64.6% |
| By Rentable Square Footage | |
| Public Operators | 37.6% |
| Other Top 100 Operators | 22.2% |
| Small Operators | 40.2% |
Nearly 65% of all U.S. self storage facilities are owned by small operators that are not in the top 100 of business operators. Public companies and REITS own 23% of facilities and the remaining top 100 operators own 13% of facilities.
When comparing ownership by square footage, however, public operators own a much larger share. Small self storage operators own 40% of rentable square footage in the U.S. Public companies and REITs own 38% and other top operators own the remaining 22%.
Public companies and REITs include Public Storage (PSA), Extra Space Storage (EXR), CubeSmart (CUBE), U-Haul International (UHAL), and National Storage Affiliates Trust (NSA).
Self Storage Industry Profit Margins
| Average profit margin of storage operators | 36% |
| Average profit margin of all industries | 22% |
While the average profit margin for all industries is 22%, the self storage industry’s profit margins are, on average, dramatically higher at 36%.
Data Sources
- Mini-storage Construction Spending, U.S. Census Bureau
- 2024 Self-Storage Almanac, Modern Storage Media
- Storage & Warehouse Leasing Industry Report, IBISWorld
- Self Storage Market Overview Q3 2023, Newmark
- Self Storage Demand Study (2023), Self Storage Association
- Radius+